Reading Assignment 12
Why This Matters
As a developer being able to communicate to not just fellow colleagues or other people with technical backgrounds, but also non-technical people. Understanding how to show trends and other data in a pictorial way that tells a story is valuable in the business world.
Questions To Answer
What does the <canvas> allow a developer to acheive?
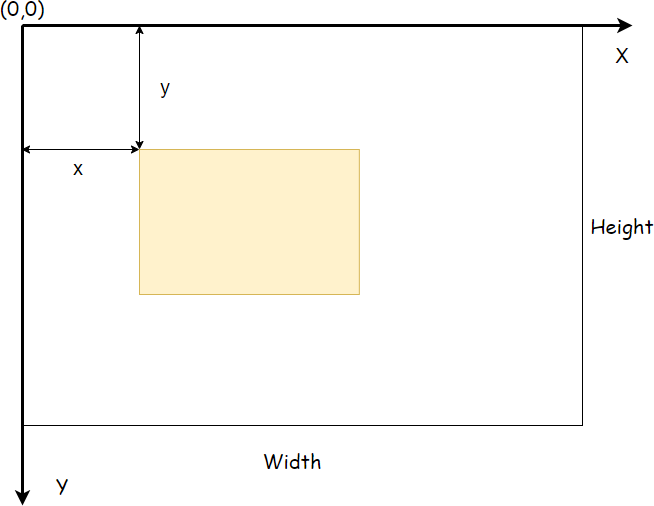
The HTML5 canvas element is used for drawing 2D graphics. Here is an example below:
What is the importance of the closing </canvas> tag?
The <canvas> element requires the closing tag </canvas>. Any content between the opening and closing tags is fallback content that will display only if the browser doesn’t support the <canvas> element. As an example:
<canvas width="600" height="450" id="whenNotSupported">The browser doesn’t support the canvas element</canvas>
Explain what the getContext() method does
The getContext() function is the function that you use to get access to the
<canvas>tags 2D drawing functions. As of April 2014, there are two types of context that are available to you: 2d and webgl. These provide you with the API that you use to draw on the<canvas>. It should be noted that the webgl context is significantly more complicated than the 2d version. The getContext() function
What is Chart.js and how it can be brought into your project?
Chart.js is a JavaScript library and allows developers to create different styles of HTML-based charts. Chart.js can be installed a number of different way. Here are some examples:
-
Using
npm: npm install chart.js –save -
Using
bower: bower install chart.js –save -
Using Github: if downloading or clone the repository, Chart.js must be built to generate the dist files. Chart.js no longer comes with prebuilt release versions, so one of the two installation methods above is strongly advised.
List 3 different Chart types you can create using Chart.js
-
Bar chart: shows data values represented as vertical bars.
-
Bubble chart: displays 3 dimensions of data at the same time. The location of the bubble is determined by an x & y axis. The third dimension is represented by the size of the individual bubbles.
-
Pie & Doughnut charts: shows the relational proportions between data and is the most commonly used charts.
-
Line chart: plots data points on a line & often used to show trend data, or the comparison of two data sets.
What are some advantages to displaying data via a chart over a table?
Although it depends on whether charts or tables have the advantage, it really depends on who the target audience is and how the data will be used. With the usage of graphs, people’s vision is stimulated by the usage of colors and pictures. A lot of data can be converted to pictures that makes people eyes quickly understand the message to be conveyed. Graphs display an easy to understand method of comprehending a ton of data and is particularly useful when there is a point to be made in the shape of the data, or for showing how different items or variables may relate/effect to each other.
How could Chart.js aid your previously created applications visually?
Thinking specifically of Salmon Cookies it could have provided how much the sales of each store compares to each other with a line graph, pie chart, or bar graph on what store is prodocing the most cookies for Pat’s Salmon Cookies. Also it could determine who is the least producing or what store has the highest traffic at a certain hour.